How to calculate a price index against your competitors
How to calculate a price index against competitors - the formula, a worked example, weighting that makes it honest, and how to read it next to sales.
Net profit dipped last quarter. Prices "felt" competitive, the team matched the obvious lines, and yet volume drifted to someone else. Before blaming the weather or the economy, there is a fifteen-minute calculation that usually finds the culprit: the price index.
This guide shows how to calculate a price index against your competitors - the formula, a worked example, the weighting decisions that make or break the result, and how to read the output next to your sales data so it actually changes prices.
What is a price index?
A price index is a normalized average that expresses your prices relative to a competitor's, for a defined set of matched products, in a defined market, over a defined period. An index of 100 means parity. An index of 104 means you are 4% more expensive on the compared basket; 96 means 4% cheaper.
Two clarifications before the math. First, this is the competitive price index retailers use to steer pricing - not the Consumer Price Index that national statistics agencies publish to track inflation. The mechanics rhyme (both compare basket costs across a reference point), but the CPI tells you where the economy is going; the competitive index tells you where your customers are going. Second, a price index without sales data attached is trivia. The point of the exercise is to find out which competitor's prices actually move your volume.
The price index formula
For each matched product, divide the competitor's price by your price. That gives a per-item price relative. Average the relatives across the matched assortment and multiply by 100.
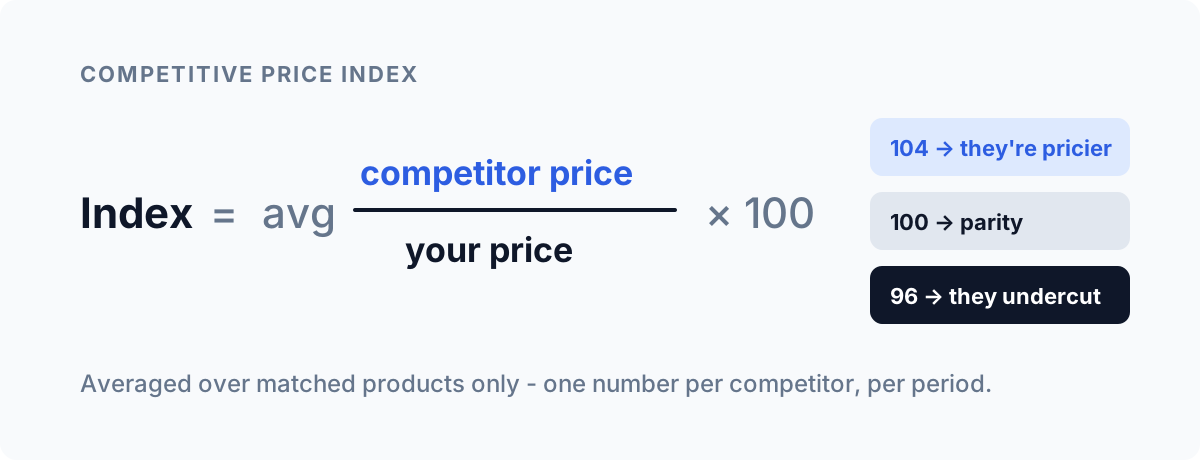
Note the direction: with competitor price in the numerator, an index above 100 means the competitor is more expensive than you, and below 100 means they undercut you. Some teams flip the ratio - your price over theirs - so pick one convention, write it down, and never mix them in the same report. More misread pricing meetings start with an inverted index than with any other error.
How to calculate a price index, step by step
Step 1 - build the matched pairs
You can only compare products both of you sell. That intersection - the overlap assortment - is the foundation of the whole calculation, and it is where most of the real work lives.
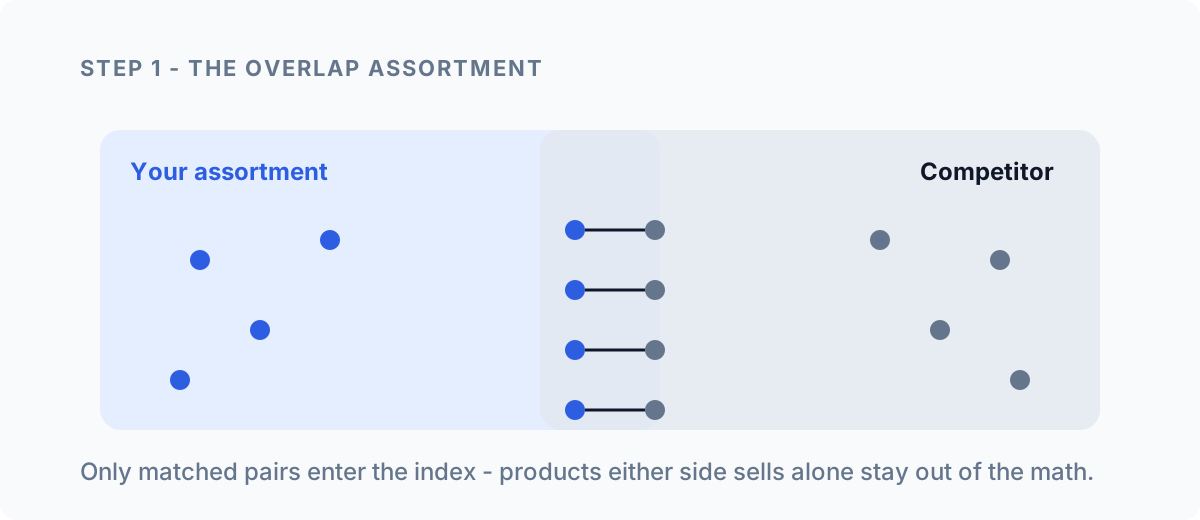
Exact-barcode matches are easy. The judgment calls are the near-matches: different pack sizes, bundles, own-brand equivalents. Standard practice is to normalize to unit price where pack sizes differ and to flag non-identical matches separately, so a "comparable" match never silently distorts an "identical" index.
Step 2 - compute per-item relatives
Competitor price ÷ your price, for every matched pair. A €10.50 competitor price against your €10.00 gives 1.05: they are 5% above you on that item.
Step 3 - average per competitor
Average the relatives for each competitor separately and multiply by 100. One number per competitor per period. Averaging across competitors into a single "market index" is a common shortcut, but do it as well as - never instead of - the per-competitor view, because it hides exactly the information you need: who is moving.
Step 4 - put it on a timeline next to sales
A single index value is a snapshot. The signal appears when you track the index weekly and overlay your sales.
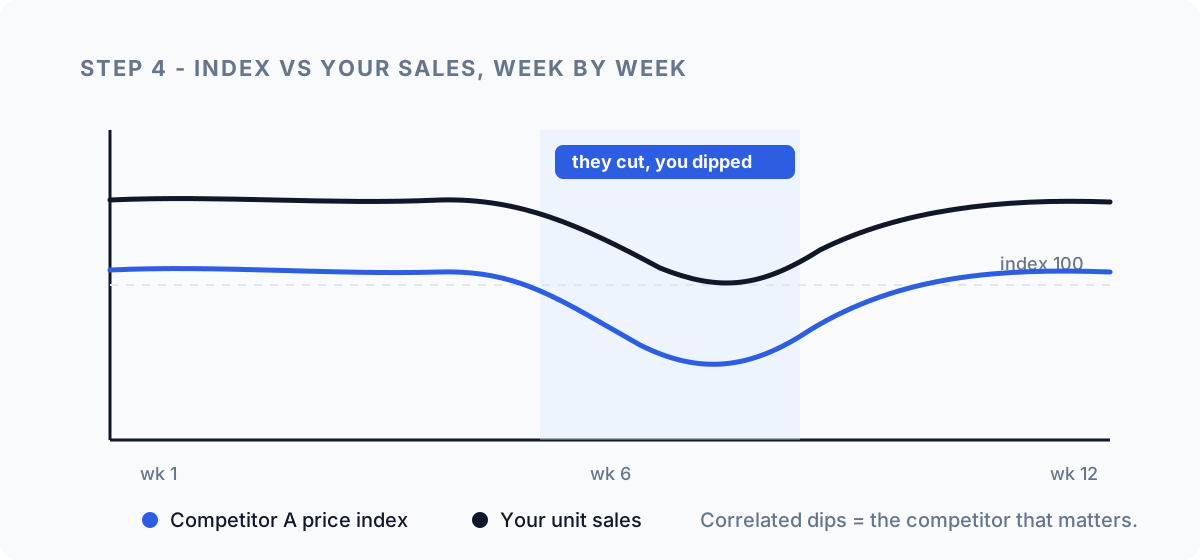
When one competitor's index drops (they got cheaper against you) and your volume dips in the same weeks, you have found your real competitor - the one whose prices shoppers actually cross-shop. Competitors whose index swings produce no echo in your sales can be monitored casually and matched never.
A worked example
You match 4 products against Competitor A. Their prices vs yours: €10.50/€10.00 (1.05), €7.60/€8.00 (0.95), €21.00/€20.00 (1.05), €4.75/€5.00 (0.95). The average is 1.00 - index 100, perfect parity.
Except it isn't. The two items where they undercut you (0.95) are your two highest-velocity lines; the two where they are expensive are slow movers. Weight the relatives by your unit sales and the index lands near 97: on the products your customers actually buy, you are 3% more expensive. The unweighted index said "parity" and lied.
Weighting: why a raw average misleads
The worked example is the rule, not the exception. Three weighting schemes cover most needs:
- Sales-weighted. Weight each relative by your revenue or units. This is the default for steering decisions - it measures the price gap your customers experience, not the one your catalogue implies.
- KVI-weighted. Shoppers form price perception from a small set of lines they buy often and remember - key value items. An index computed on KVIs only tells you how price perception is trending, which is often more decision-relevant than the full-basket number.
- Unweighted. Still useful as a completeness check across the whole overlap, and for spotting tail items drifting far out of corridor.
Run the KVI-weighted index tight (say, 98-102 against your reference competitor) and let the tail breathe wider. That is the whole strategy of index-based pricing in one sentence: precise where shoppers look, profitable where they don't.
Five mistakes that quietly corrupt a price index
Beyond the mechanics, a handful of recurring errors produce indexes that look precise and steer wrong:
- Counting out-of-stock prices. A competitor's aggressive price on an item they cannot ship is not a price - it's a decoy. Exclude or flag matches where the competitor shows no availability, or you will chase phantom gaps.
- Mixing channels and regions. A competitor's online price, marketplace price, and store price in one index average three different strategies into one meaningless number. Index per channel, per market - then compare.
- Letting the overlap drift. If this month's index covers 480 matched SKUs and last month's covered 610, the two numbers are not comparable, even if both say 101. Track overlap size alongside the index and investigate jumps.
- Treating the index as a target instead of a reading. Repricing to force the index to 100 everywhere is how price wars start - you match them, their automation matches you back, and the whole category ratchets down. The index tells you where you are; strategy decides where you should be.
- Ignoring who they undercut you for. A competitor running index 95 against you on clearance stock they are exiting is noise. The same index on their replenished core range is a strategic move. Same number, opposite meaning.
Where manual calculation breaks down
A spreadsheet handles this comfortably for one banner, three competitors, and a few hundred matched SKUs. The breaking points come fast, though:
- Data freshness. Competitor prices in fast categories change daily or intraday. An index computed on week-old scrapes compares you to prices that no longer exist.
- Match quality. Matching is not a one-off project - assortments churn constantly, and every broken match silently biases the index. Match maintenance is the hidden majority of the workload.
- Promo handling. Is the competitor's price their shelf price or their promo price? Mixing the two in one index makes you chase discounts that end on Sunday. Track regular and promo indexes separately.
- Scale. Ten competitors × twenty thousand SKUs × daily updates is two hundred thousand fresh relatives a day. That is no longer a spreadsheet - it's a pipeline.
The honest framing: the formula was never the hard part. Reliable inputs at scale are the hard part, which is why index tracking is usually the first thing retailers automate - the calculation layer moves to software, and the team's time moves to deciding what to do about an index of 104.
From index to action
The index tells you where you stand; it doesn't tell you where you should stand. That takes two more inputs. Competitive context - which competitor matters per category, covered in our competitor pricing analysis playbook - and demand response: whether closing a 4% gap will actually win back volume, which is a price elasticity question. An index gap on an inelastic product is not a problem; the same gap on an elastic KVI is a leak.
In Retailgrid, matched competitor prices flow into the same workbook as your costs and sales, so the index, the elasticity, and the margin impact of closing a gap sit in one view - and every repricing decision made from them is explainable and auditable after the fact.
Frequently asked questions
What is a good price index to target?
Depends on your positioning and the weighting. A premium-service retailer might run 103-105 sales-weighted and thrive; a price-fighter needs 97-100 on KVIs. The target that matters is stability against your reference competitor on the items your shoppers price-check.
How many products do you need for a reliable index?
Enough overlap to represent the categories you compete in - as a rule of thumb, a few hundred matched SKUs per competitor gives a stable read for a mid-sized assortment. Below a few dozen matches, single products swing the index and you are reading noise.
How often should the index be updated?
Match the cadence of your market. Electronics and online-heavy categories: daily. Grocery: weekly is workable, daily is better. The test is simple - if competitors reprice faster than you measure, your index is a history lesson.
Want to see your own price index - matched, weighted, and next to your sales - without building the pipeline yourself? Get in touch and we'll set it up on your data.
Founder and CEO of Retailgrid. 20 years in retail pricing, from Nielsen and IBM DemandTec to founding GoalProfit, a price optimization company he sold in 2023.