Closing the price perception gap: a KVI workflow
Shoppers price 300 items, not your assortment. A category manager's workflow for finding the KVIs that drive price perception and closing the gap.
"Well, that's still cheaper at Target or Walmart. What are you guys doing?" That is a real customer question, relayed by Josh Wing of Coborn's at last week's GroceryNEXT conference. Every category manager at a regional retailer has heard a version of it. And here is the uncomfortable part: the customer saying it is often wrong on the facts - and it does not matter. Price perception is what shoppers act on, not your price index. If your index says you are competitive and your shoppers say you are expensive, you have a perception gap. This article is a working checklist for closing it.
Why your price index and your shoppers disagree
Start with the evidence that perception and reality genuinely drift apart. A Consumer Reports price study reported by Supermarket News this year found several chains beating the retailer most shoppers assume is cheapest: Costco came in 21.4% below Walmart, Lidl 8.5% below, Aldi 8.3% below. Meanwhile shoppers keep telling regional grocers that everything is "still cheaper at Walmart". Both things are true at once. Prices are one dataset; beliefs are another.
The mechanism is well understood. Shoppers do not compute a basket average across 30,000 SKUs. They remember the price of a small set of items they buy constantly and know cold - milk, bananas, ground coffee, diapers, the branded soda on the end cap. Those are your key value items, and they carry almost all of your price image. Get them wrong and the shopper extrapolates: if the milk is 30 cents over, the whole store is expensive. Get them right and the same shopper forgives a lot in the aisles they cannot price from memory.
This is also why the perception gap hits mid-market and regional retailers hardest. The 2026 Grocery Value Study presented at GroceryNEXT found that 65% of consumers name low everyday price as their primary value driver - ahead of quality, service, and experience. The same study scored regional chains ahead of national chains on in-store execution, 84.3% to 79.6%. Regionals are winning the store and losing the story. That is fixable, because the story is written by a few hundred SKUs.
Step 1 - find the items that drive price perception
If you have not formally identified your key value items, that is the first workstream. We have covered what KVIs are and how to price them in detail, so here is the short version of the identification pass:
- Purchase frequency and penetration. Rank items by how many distinct baskets they appear in, not by revenue. A €2 item bought weekly by half your shoppers shapes perception more than a €40 item bought twice a year.
- Price knowledge. Flag items where shoppers can quote the price unprompted. Proxy signals: high promo response, high search volume on your site, items that appear in competitor ads.
- Competitor overlap. An item only drives comparison if the shopper can actually compare it. Branded staples that Walmart, Aldi and the discounters all carry belong at the top of the list. Private label with no direct equivalent belongs lower.
Expect the list to land between 3% and 8% of your assortment. If your KVI list is 20% of the catalogue, you have not prioritised - you have relabelled the catalogue.
One refinement worth doing on the first pass: KVIs are not uniform across your shopper base. The young-family basket, the pensioner basket and the convenience-topup basket each anchor on different items. You do not need a full segmentation model to act on this - splitting penetration rankings by two or three loyalty segments is usually enough to catch items that a blended ranking buries, like formula and nappies, which barely register overall but define price perception entirely for the shoppers who buy them.
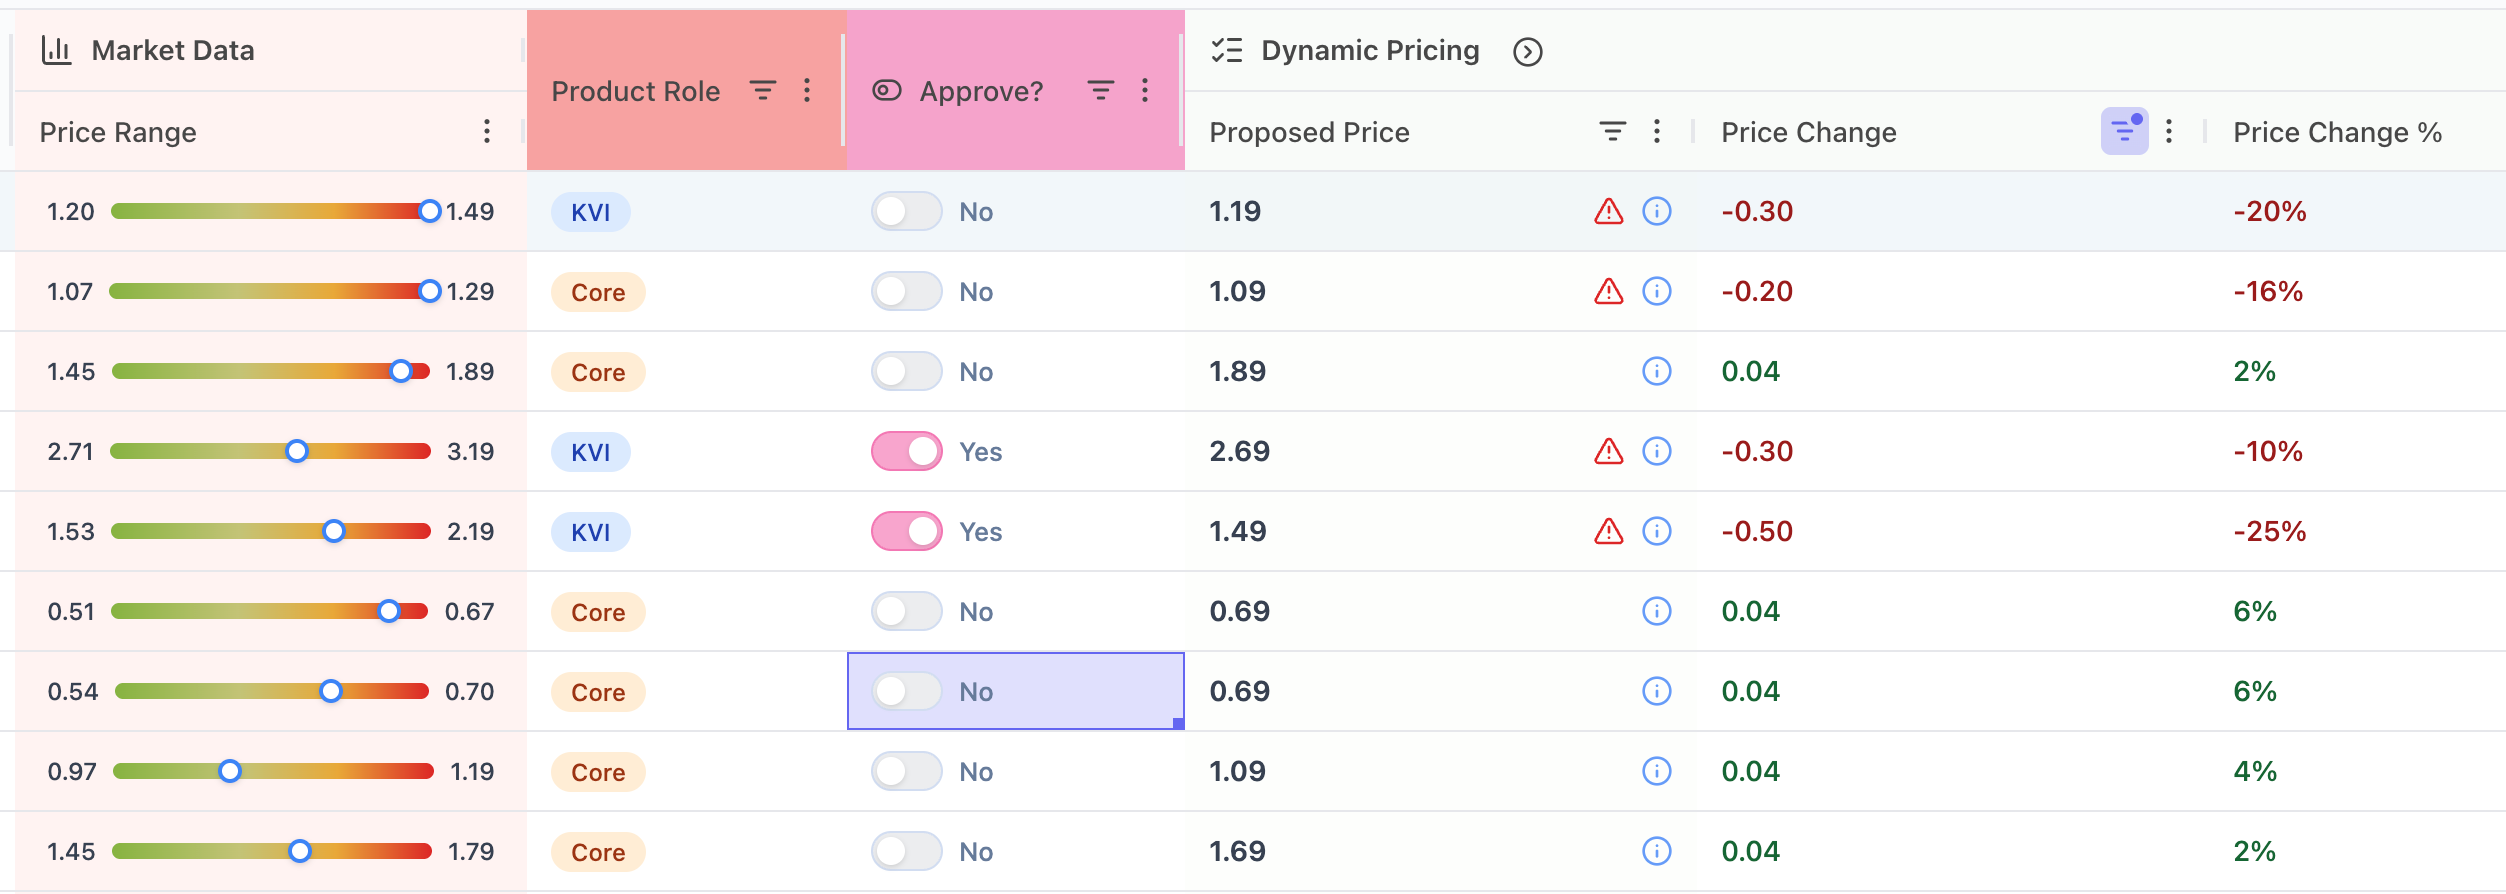
Step 2 - split your competitive price index
Most retailers already track a competitive price index. The problem is almost always the weighting. A flat index across the assortment - every SKU counts equally - will happily report 99 against your key competitor while your KVIs sit at 106. The flat number goes in the board deck; the 106 goes in the shopper's memory.
So split the index. Build one competitive price index for your KVI set and a separate one for the tail, and weight the KVI index by basket penetration rather than by revenue. Then trend both weekly against your two or three reference competitors. The picture this produces is often uncomfortable and always useful: a retailer can be genuinely cheaper on the full basket and measurably expensive on the 300 items shoppers use to judge them.
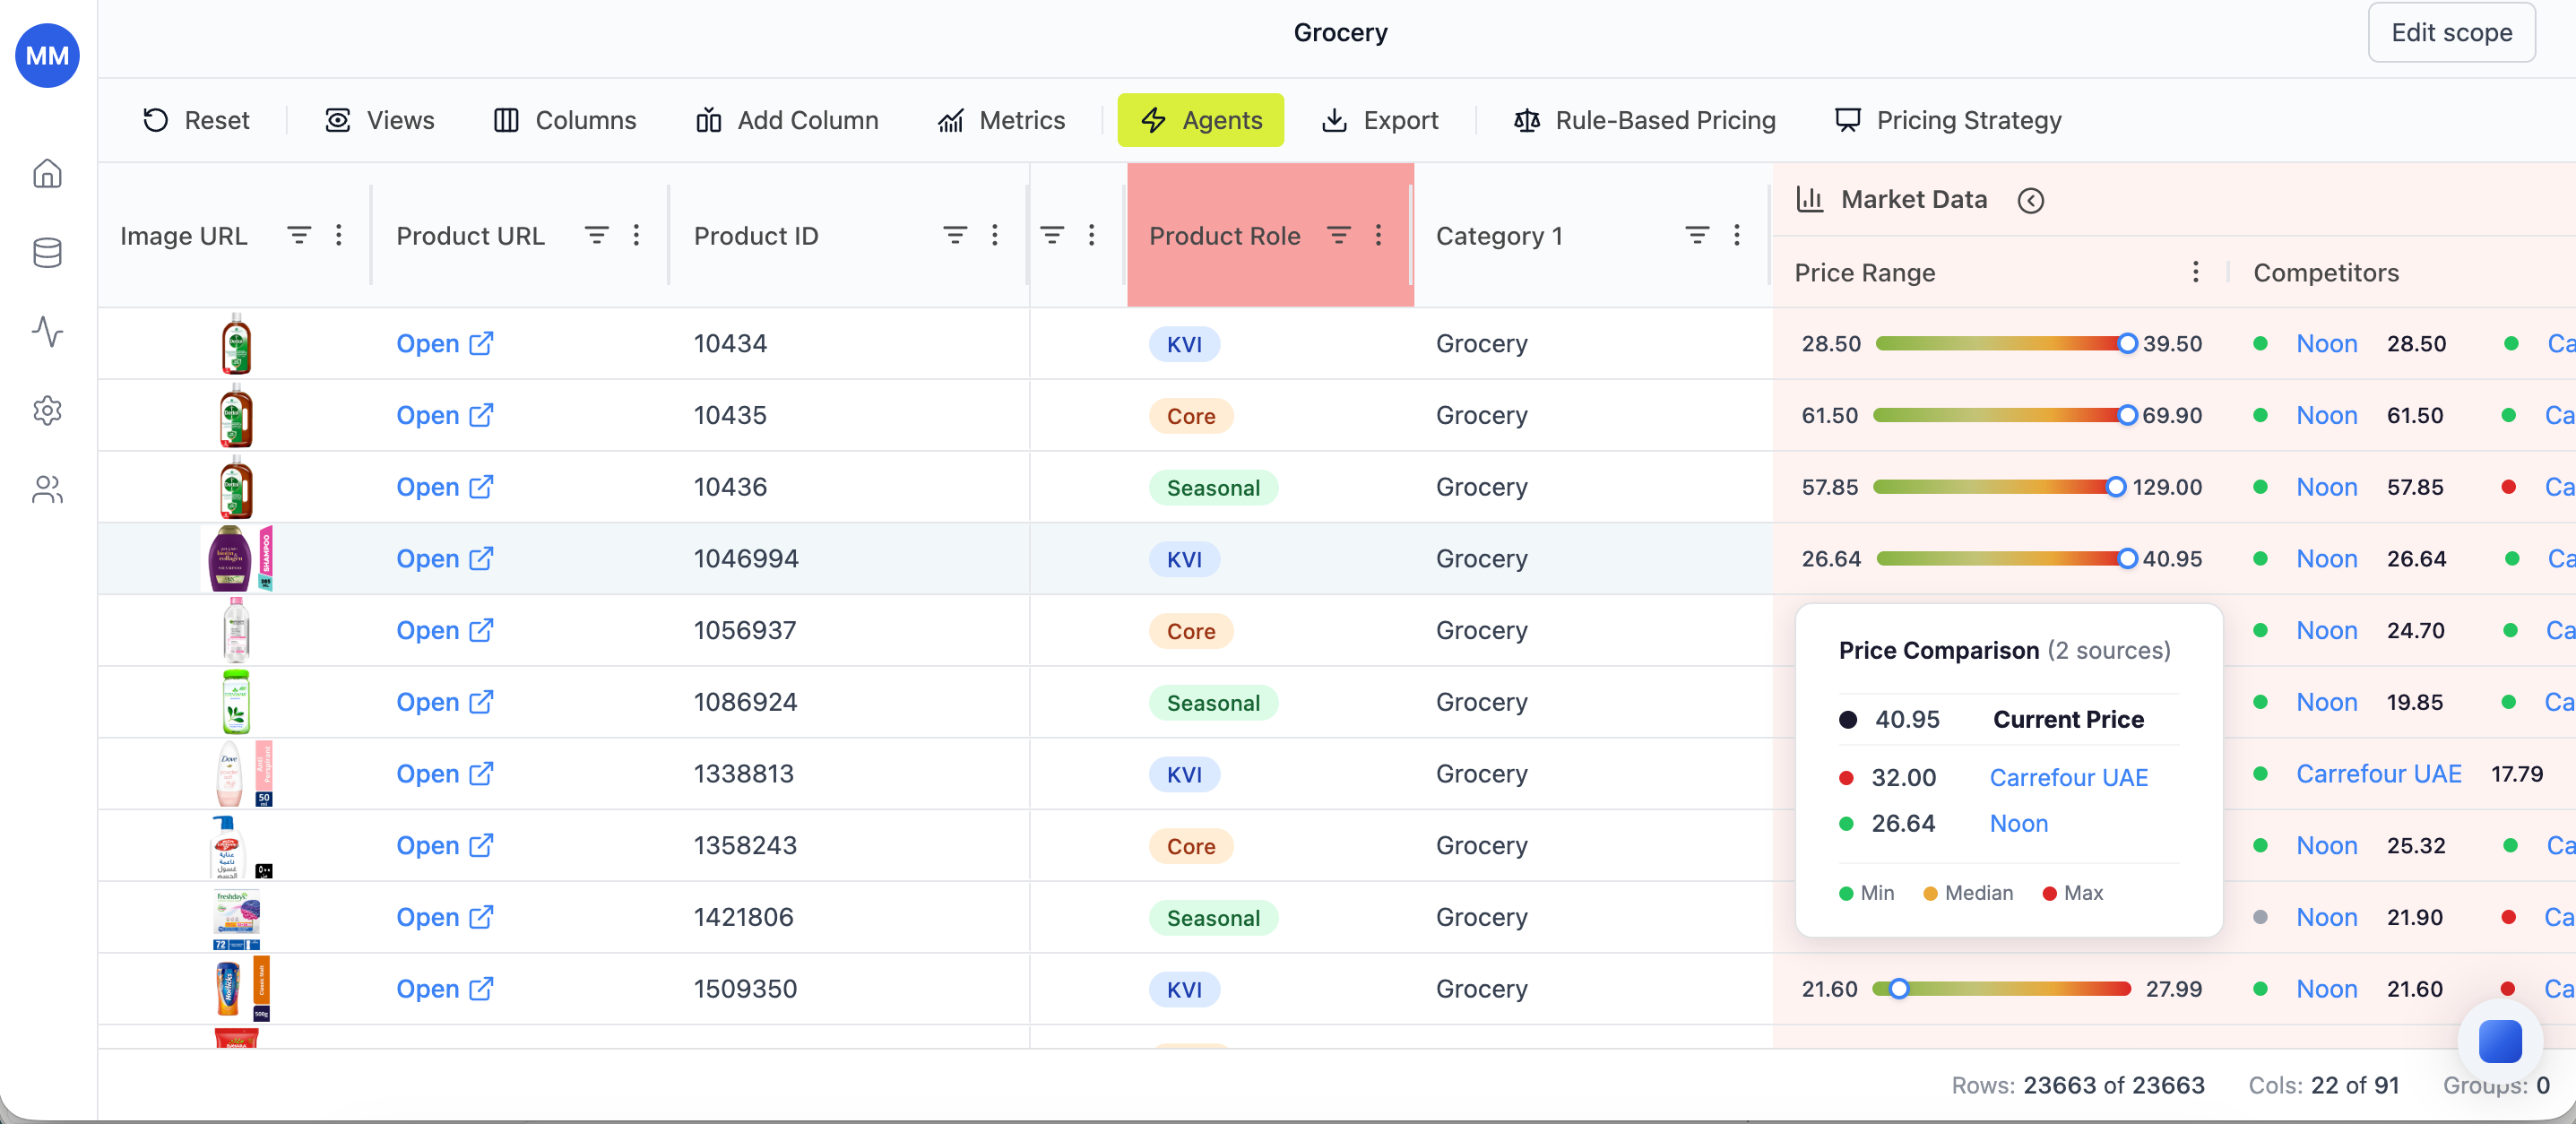
The Northeast numbers published last week show how wide the field really is. The Market Report's August basket study priced 50 common items across 35 stores: Aldi at $246.13, Walmart at $265.85, Market Basket at $278.33, against a regional average of $353.14. That is a 43% spread between the cheapest operator and the average store on the exact items shoppers know best. If you are anywhere near that average without a deliberate KVI position, the "still cheaper at Walmart" conversation is already happening at your registers - whether the full-basket maths supports it or not.
Step 3 - reprice the head, recover in the tail
Closing a KVI gap costs margin, so the workflow has to fund itself. The mechanics that make it affordable:
- Match where comparison is direct. On true KVIs with identical competitor items, hold a defined gap to your reference competitor - at parity, or a fixed percentage above it that you have decided you can defend. Make the gap a written rule, not a weekly judgement call.
- Recover where comparison is weak. The tail - low-frequency items, private label without a direct equivalent, long-tail sizes and flavours - is where margin comes back. Elasticity is lower there and price knowledge is close to zero.
- Mind the cross-effects. A KVI price cut that pulls traffic pays for itself through the rest of the basket. One that just marks down existing volume does not. Judge KVI moves on basket economics, not item P&L.
The discipline that holds this together is making every price explainable. Each KVI should carry a rule you can state in one sentence: "matched to reference competitor", "held 2% above, gap reviewed weekly". When the pricing committee asks why milk margin fell, the answer is in the rule, not in someone's recollection. That is the difference between a grocery pricing strategy and a pile of reactions.
Step 4 - watch it weekly, not quarterly
A perception gap is not closed once. Competitors move, promotions distort the picture, and cost increases creep back into the exact items you repriced. The Northeast study above is a live example of how fast the ground shifts: Aldi cut its basket 11.5% between January and August, and one regional player cut roughly 45%. A KVI position set against January prices was stale by Easter. The retailers who hold a price position review their KVI index on a weekly cadence: fresh competitor prices in, the split index recalculated, and a short exception list of KVIs that have drifted outside their rule. The review should take thirty minutes, not an afternoon - if it takes an afternoon, the data collection is the problem, not the pricing.
Two practical notes on the monitoring itself. First, match quality decides everything: an index built on loose product matches will show gaps that do not exist and hide ones that do, so invest in verified matches on the KVI set before trusting any number it produces. Second, keep the history. When a merchant asks in October why a gap rule was set to 2% in September, the answer should be auditable - the competitor prices, the decision, and the date, all on record.
What this doesn't change
A KVI workflow closes the gap between your prices and your price image. It does not fix everything that shapes value perception, and pretending otherwise is how pricing teams lose credibility. If your promo depth is half your competitor's, if availability on staples is patchy - the 2026 Grocery Value Study scored product availability at 72.2%, the weakest link in the whole shopping journey - or if the store experience tells a premium story your prices contradict, KVI pricing will not paper over it. Perception is also built by the weekly ad, the shelf edge, and whether the advertised item is actually in stock. Price the head right, and then make sure the rest of the operation is not undoing the work.
It is also not a race to the bottom. The goal is not to beat the hard discounters on their own game - the Northeast study makes clear how much structural cost advantage that would take. The goal is to stop losing shoppers over a gap you did not know you had, on items you could have fixed for a fraction of a blanket price cut.
Where to start this week
Pull your transaction data and rank items by basket penetration. Take the top 200. Get verified competitor prices for them. Build the split index. That is the whole first iteration - one analyst, one week, no new tooling required. What the exercise almost always shows is a handful of visible items carrying an outsized share of the "you're expensive" story, and a tail quietly able to fund the fix.
If the data collection is the bottleneck - matching your items to competitor items and keeping the prices fresh - that is the part worth automating first. It is the layer Retailgrid was built for: explainable matches, rules-based KVI pricing, and an auditable trail for every price move. If you want to see how a split KVI index looks on your own assortment, talk to us - bring your top 200 items and we will show you the gap.
Founder and CEO of Retailgrid. 20 years in retail pricing, from Nielsen and IBM DemandTec to founding GoalProfit, a price optimization company he sold in 2023.