Price elasticity of demand: a retailer's practical guide
What price elasticity of demand is, how to calculate it with a worked example, and how retailers turn elasticity into portfolio-level price decisions.
Raise the price of one product by 5% and revenue climbs. Raise another by the same 5% and units fall off a cliff, taking margin with them. The difference between those two outcomes has a name: price elasticity of demand. It is the single most useful number a pricing team can estimate - and one of the easiest to get wrong.
This guide covers what price elasticity of demand is, how to calculate it with a worked example, what separates elastic vs inelastic demand, and - the part textbooks skip - where the clean formula collides with messy retail data.
What is price elasticity of demand?
Price elasticity of demand (PED) measures how much the quantity demanded of a product changes when its price changes. If a small price increase causes shoppers to abandon the product, demand is elastic. If they keep buying at nearly the same rate, demand is inelastic.
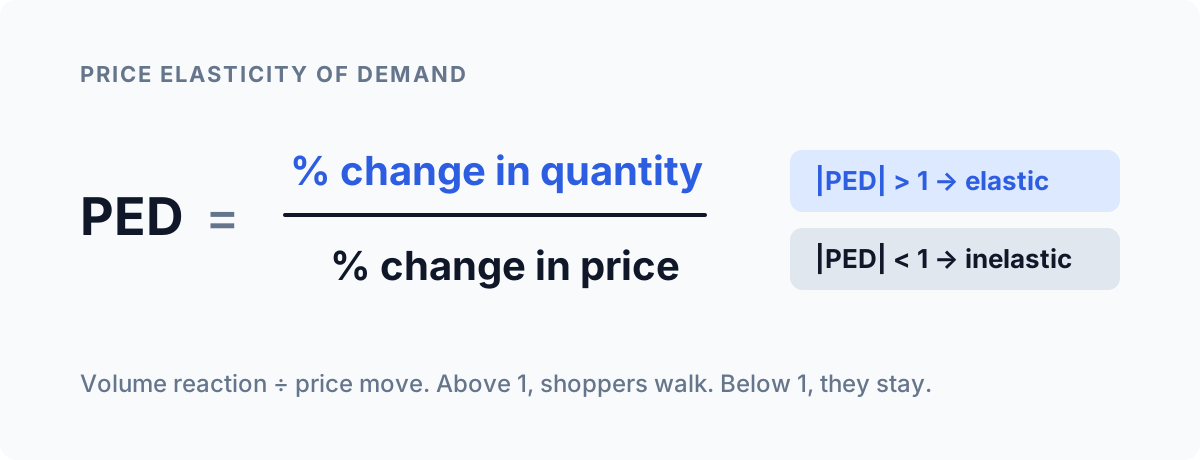
The result is almost always negative - price up, volume down - so retailers usually quote the absolute value. The threshold that matters is 1:
- |PED| > 1 - elastic. Volume reacts more than proportionally to price. Price cuts can grow revenue; price increases shrink it.
- |PED| < 1 - inelastic. Volume barely moves. Price increases grow revenue; price cuts just give margin away.
- |PED| = 1 - unit elastic. Revenue stays flat either way; only margin shifts.
Why the stakes are high: McKinsey's long-running pricing research found that a 1% price improvement lifts operating profit by roughly 8% for the average S&P 1500 company - if volume holds. Elasticity is the number that tells you whether volume will hold.
How to calculate price elasticity of demand: a worked example
Say you run coffee in a grocery banner. Your own-brand ground coffee sells 1,000 units a week at €6.00. You raise the price to €6.60 - a 10% increase - and weekly volume drops to 850 units, a 15% decrease.
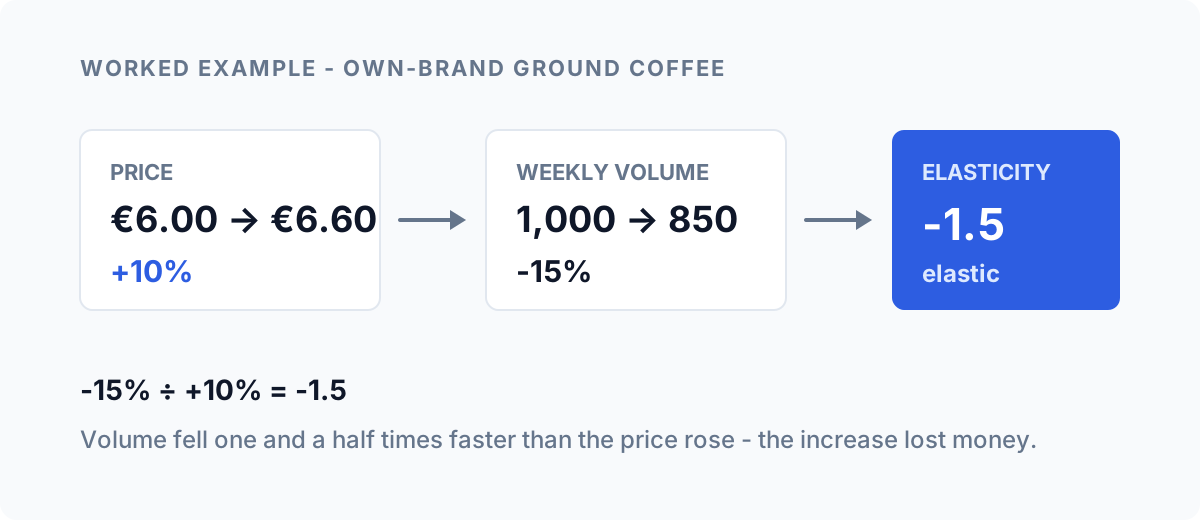
Divide the volume change by the price change: -15% ÷ 10% = -1.5. Demand is elastic. The increase cost you more revenue in lost units than it gained in price, so this SKU was the wrong place to take pricing.
One refinement worth knowing: because percentage changes differ depending on which direction you measure, analysts often use the midpoint method - dividing the change by the average of the old and new values rather than the starting value. For a 10% move it barely matters. For a 40% markdown it matters a lot.
Elastic vs inelastic demand: what the curves tell you
Plotted on a demand curve, elasticity is the slope of the relationship between price and volume. A flat curve means small price moves swing volume hard - elastic. A steep curve means volume holds as price moves - inelastic.
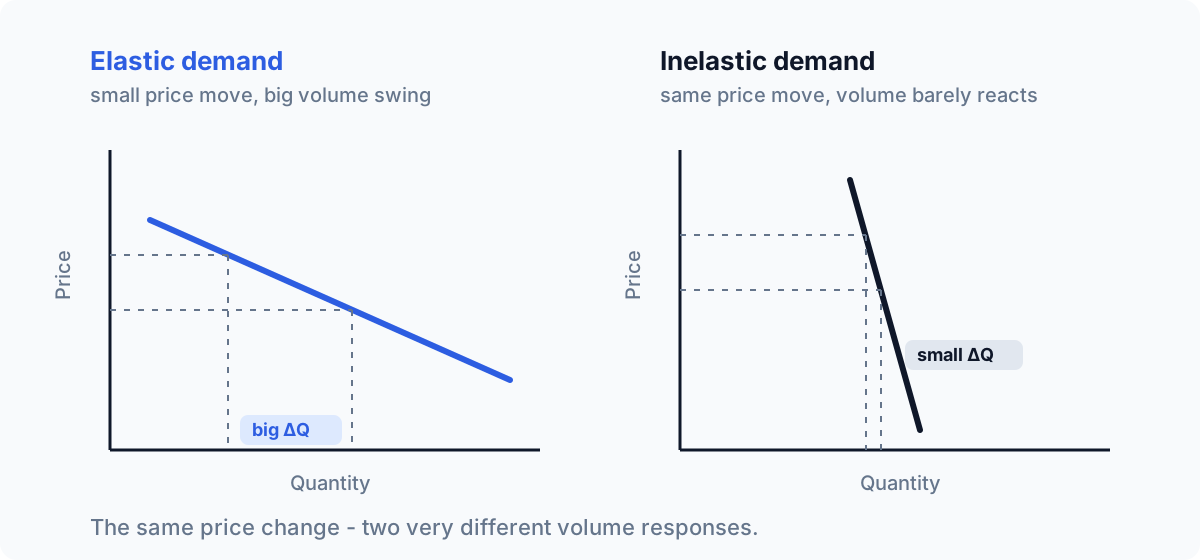
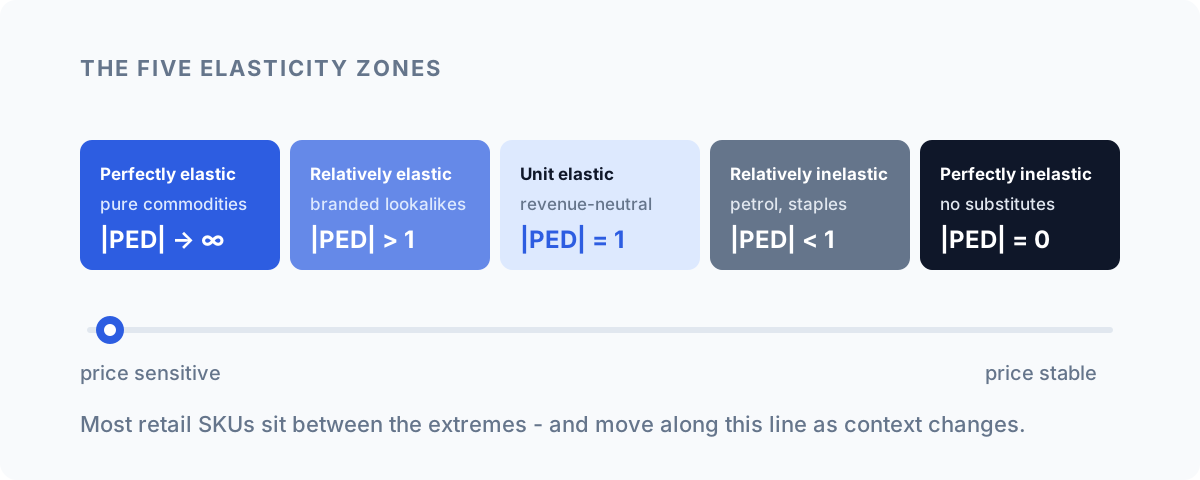
Classic examples: branded chocolate bars with five lookalike substitutes on the same shelf are elastic - shoppers switch without a second thought. Petrol, baby formula, and prescription-adjacent items are inelastic - people buy what they need at the price they find. In Harvard Business Review's refresher on price elasticity, Amy Gallo describes the full spectrum, from perfectly elastic pure commodities to perfectly inelastic goods with no substitutes at all.
What actually drives elasticity in retail
Four factors explain most of the variation you will see across your assortment:
- Substitutes. The more credible alternatives sit next to a product - on your shelf or one browser tab away - the more elastic it becomes. This is the dominant driver in most categories.
- Necessity. Products people cannot postpone or skip are less price sensitive. Discretionary and indulgence purchases are more so.
- Price visibility. Shoppers only react to prices they notice. Research on key value items shows consumers track prices on a small set of frequently bought lines and infer everything else. High-visibility items behave elastically; long-tail items often do not.
- Time and lifecycle. New products with no substitutes start inelastic and become elastic as competitors match them. End-of-life and markdown stock is usually highly elastic.
The practical consequence: elasticity is not a property of a product. It is a property of a product in a context - a shelf, a competitor set, a season. When the context changes, the number changes.
Where the textbook math breaks down in practice
The formula is simple. Getting a trustworthy number for thousands of SKUs is not, and it is worth being honest about why:
- Sparse data. A clean elasticity estimate needs multiple observed price points with enough volume at each. Most SKUs change price a handful of times a year. For slow movers, you may never have enough signal at the SKU level - you have to pool estimates across similar products.
- Promo contamination. A price cut that ships with a display, a leaflet slot, and an end cap measures promotion, not elasticity. If you don't separate the mechanics, every estimate comes out inflated.
- Cross-effects. Cutting one SKU's price cannibalizes its neighbours and lifts complements. Single-SKU elasticity math is blind to both, which is how a "successful" price cut quietly moves volume from your 40%-margin product to your 25%-margin one.
- Everything else moved too. Seasonality, weather, stock-outs, and competitor moves all shift volume at the same time as your price change. Without controlling for them, you are attributing their effects to price.
None of this makes elasticity useless. It means a single number without a confidence range is a guess wearing a lab coat. Treat low-confidence estimates as hypotheses to test with small moves, not licences for big ones.
Revenue elasticity is not profit elasticity
The |PED| = 1 threshold everyone learns marks where revenue flips - and revenue is the wrong finish line for a retailer. What you protect is margin, and the margin-neutral threshold sits somewhere else entirely.
The break-even elasticity for a price increase is roughly the price divided by the unit margin. Take the coffee example: at €6.00 with a €1.50 margin, the ratio is 6.00 ÷ 1.50 = 4. A price increase adds profit as long as |PED| stays below 4 - even though revenue starts falling at 1. Our SKU measured -1.5: the increase lost revenue but, run the margin math, it may still have made money. On a thin-margin product the same logic bites the other way: with a €0.30 margin on a €6.00 item the threshold is 20, and almost no price cut can generate enough volume to pay for itself.
This is why "the demand is elastic, don't raise prices" is too crude a rule. The decision needs three numbers - elasticity, price, and unit margin - and it changes SKU by SKU. It is also why price cuts on low-margin traffic drivers so often disappoint: the volume response is real, but the margin per incremental unit is too small to cover what was given away on the base volume. You can pressure-test this on your own numbers with our pricing ROI calculator.
Cross-elasticity: the effect nobody budgets for
Everything above is own-price elasticity - one product's volume responding to its own price. In a real assortment, prices leak sideways. Cut the 500g pack and the 1kg pack loses volume (substitution). Cut the coffee and filter sales rise (complements). Cross-price elasticity measures these spillovers, and at category level they routinely decide whether a price move that "worked" at SKU level actually created any new profit - or just rearranged existing sales at a lower margin.
The practitioner shortcut: before celebrating a volume lift, check the two or three closest substitutes for a matching dip over the same weeks. If the lift on one line roughly equals the dip on its neighbours, you ran a cannibalization event, not a growth event.
From single-SKU math to portfolio decisions
Elasticity earns its keep when it changes decisions at scale. In practice that means three moves:
Segment the assortment by elasticity and role. Price-sensitive, high-visibility items get competitive pricing and careful increases. Inelastic long-tail items carry margin. This is the quantitative backbone of the product-role logic we cover in our retail pricing strategies playbook.
Pair elasticity with competitive position. An elastic SKU priced 10% above the market is a volume leak. An inelastic SKU priced below the market is margin left on the table. You need both numbers - elasticity and a price index against competitors - to see which is which.
Size price moves by confidence. Where the data supports a strong estimate, take the full recommended move. Where it doesn't, take a smaller step and measure. This is exactly how the Retailgrid price optimization engine works: it estimates elasticity at six levels of aggregation, picks the most confident tier per SKU, and only moves a price as far as the evidence allows - with the reasoning visible for every recommendation.
Manual elasticity work tops out at a few dozen SKUs per analyst. If your assortment runs to five or six figures, the calculation layer has to be software - the judgment layer stays human. That division of labour is what price optimization software is for.
Frequently asked questions
What is a good price elasticity of demand?
There is no universally good value - it depends on your goal. For a margin play you want inelastic SKUs (|PED| < 1), where increases stick. For a traffic play you want elastic SKUs (|PED| > 1), where cuts generate disproportionate volume. Most retail SKUs land between 0.5 and 2.5.
How often should elasticity be re-estimated?
Whenever the context shifts: new competitor entry, inflation waves, assortment resets, or season changes. As a floor, re-estimate quarterly for fast movers and semi-annually for the tail. A number estimated in a different demand environment is a different number.
Can you calculate elasticity without an experiment?
Yes - from historical price and sales data, if the data contains enough natural price variation and you control for promotions and seasonality. Where history is too flat, small deliberate price tests on a subset of stores or SKUs fill the gap faster than waiting.
If you want to see what elasticity-based pricing looks like on your own assortment - which SKUs can carry an increase, which are leaking volume, and what the revenue impact would be - talk to us. Bring a sales export; we'll bring the math.