Competitive price index: what it is and how to calculate it
How to calculate your competitive price index (CPI) - the formula, a worked example on your own catalog, weighted CPI, and how to read the result against sales.
Every week, somewhere in a mid-market retail business, a category manager is trying to answer a question that should be simple: are our prices competitive?
The answer usually comes from gut feel, a quick scroll through a competitor's website, or a spreadsheet that someone built six months ago and hasn't updated since. None of these answers are reliable. And without a reliable answer, every pricing decision that follows - promotions, markdowns, margin adjustments - is built on a shaky foundation.
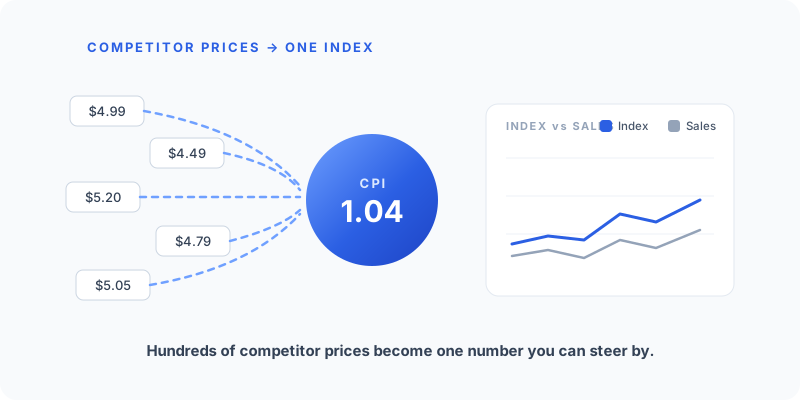
The Competitive Price Index (CPI) is the reliable answer. It is a single, calculated number that tells you exactly where your prices sit relative to your competitors at any given moment. It is not complicated to understand. And once you know how to calculate it, it changes how you make pricing decisions permanently. This guide covers what the Competitive Price Index is, the formula behind it, how to calculate it step by step on your own data, and what to do with the result.
What is the competitive price index?
The Competitive Price Index is a normalized ratio that expresses your prices relative to a defined set of competitors, across a defined set of matched products, for a defined time period.
In plain language: if your CPI is 1.0, your prices are exactly at the market average. If your CPI is 1.08, you are priced 8% above the market. If your CPI is 0.94, you are priced 6% below it.
That number - a single decimal - contains more useful information than a hundred rows of competitor price exports. It tells you your position, not just individual product prices. It tells you the gap, not just the direction. And it is calculable in 15 minutes on a spreadsheet if you have the raw data.
Do not confuse the Competitive Price Index with the macroeconomic Consumer Price Index (CPI), which tracks inflation across a basket of consumer goods. The metric this guide covers is retailer-specific - it measures your prices against your competitors, not against a national average.
Why it matters more than you think
Here is the counterintuitive thing about competitive pricing: the correlation between your prices and your sales is often stronger than any other single variable - but it works with a time lag that makes it invisible in normal reporting.
If your CPI rises above 1.05 in a price-sensitive category - meaning you are more than 5% above the market - you will typically see conversion drop within 48 to 72 hours. By the time that drop shows up in a weekly sales review, the cause has been obscured by promotional activity, day-of-week variation, and a dozen other factors.
The retailers who use CPI consistently are the ones who catch that correlation before it becomes a margin problem. They monitor their index by category, by competitor, and by SKU group - and they act on it before the sales impact lands.
The competitive price index formula
The calculation works in three stages.
Stage 1: per-product price index
For each product where you and a competitor have a matching SKU, calculate the ratio of your price to their price:
Product Price Index = Your Price ÷ Competitor Price
Example: your price for a 500ml hand sanitizer is $4.99; Competitor A's price for the same product is $4.49. Product Price Index = 4.99 ÷ 4.49 = 1.11. You are priced 11% above Competitor A on this product.
Stage 2: competitor-level price index
Average the product-level indexes across all matched SKUs with that competitor:
Competitor CPI = Sum of all Product Price Indexes ÷ Number of matched SKUs
Example: you have 40 matched SKUs with Competitor A, and the sum of all product price indexes is 44.8. Competitor CPI = 44.8 ÷ 40 = 1.12. You are priced 12% above Competitor A on average across matched products.
Stage 3: market-level price index
Average the competitor-level CPIs across all competitors:
Market CPI = Sum of all Competitor CPIs ÷ Number of competitors
Example: Competitor A CPI 1.12, Competitor B CPI 0.98, Competitor C CPI 1.04. Market CPI = (1.12 + 0.98 + 1.04) ÷ 3 = 1.047. Your prices are 4.7% above the market average across this category.
Step by step: how to calculate it on your own data
Here is the practical workflow you can run on a spreadsheet today.
Step 1 - collect matched product pairs
Pull your product list and your competitors' product lists for the category you want to analyze. Match products by name, brand, model number, EAN/UPC, or any reliable identifier. This is the hardest step - product matching accuracy is the single biggest source of error in CPI calculations. A wrong match (your premium version against their entry-level product) produces a number that is confidently wrong. For each matched pair, record your SKU identifier, your current price, the competitor name, the competitor price, and the date of data collection.
Step 2 - calculate per-product price indexes
In a spreadsheet column, apply the formula = Your Price / Competitor Price for every matched product pair, for every competitor. If you have 100 matched products with three competitors, you will have up to 300 rows.
Step 3 - calculate per-competitor averages
Group the product-level indexes by competitor and take the average. In Excel or Google Sheets: =AVERAGEIF(competitor_column, "Competitor A", index_column). This gives you a single number per competitor: your price position against them specifically.
Step 4 - calculate the market-level CPI
Average the competitor-level numbers. This is your overall market CPI for the category.
Step 5 - add your sales data
This is the step most teams skip, and it is the step that makes CPI actually useful. Plot your CPI over time on one axis and your category sales on the other. The correlation - where it exists - will become visible. The competitors whose CPI movements correlate most with your sales changes are your real competitors, not just the obvious ones.
Step 6 - build a chart
Visualizing the CPI over time next to sales data surfaces the correlations that a table cannot. A CPI that moves above 1.05 and stays there for more than three days, while sales soften - that pattern is your signal.
How to read the result
CPI below 0.95
You are priced more than 5% below the market average. In categories with high demand elasticity, this likely means you are leaving margin on the table - demand is not sensitive enough to the price gap to justify the discount. Consider moving prices up toward market parity on low-elasticity SKUs.
CPI between 0.95 and 1.05
You are within 5% of the market average. This is the target band for most KVIs and high-visibility products - competitive enough to maintain conversion, not so aggressive that you sacrifice margin unnecessarily.
CPI between 1.05 and 1.12
You are priced 5-12% above the market average. In price-transparent categories (electronics, grocery, health and beauty), this range typically starts to generate conversion pressure. Monitor sales velocity closely. On products where you have genuine differentiation or exclusivity, this range may be sustainable.
CPI above 1.12
You are priced more than 12% above the market average. Unless there is a strong reason (brand premium, exclusivity, superior service), this position is likely generating measurable conversion losses. It warrants an immediate pricing review.
The limitation of manual CPI calculation
Running this calculation once is instructive. Running it consistently - across a full catalog, across multiple competitors, on a daily basis - is practically impossible manually.
The problems compound quickly. Competitor prices change every four hours in fast-moving categories. Product matches need updating when catalogs change. The spreadsheet that was accurate on Monday is already stale by Thursday. And the analysis that showed you which competitor was driving your sales drop last quarter tells you nothing about who is driving it today, if their prices have moved since you last checked.
This is exactly the problem that Retailgrid's price monitoring solves. Competitor prices are scraped every four hours, matched to your SKUs automatically, and fed directly into a Competitive Price Index dashboard that updates without manual intervention. Category managers see their CPI by product, by competitor, and by category - in real time, not after a Friday afternoon data pull. When the CPI on a category crosses a defined threshold, the platform triggers a repricing rule automatically - or flags it for human review, depending on how you have configured the autonomy settings. The 15-minute manual calculation becomes a live signal your team acts on, not a weekly report they catch up on.
Calculating CPI by competitor: why it matters
The market-level CPI is useful for a category overview. The competitor-level CPI is where the real insight lives.
Retailers who run CPI by competitor consistently discover something that surprises them: not all competitors affect their sales equally. A competitor whose CPI moves in close correlation with your sales changes is a price setter in your category - a business whose prices your customers are actively comparing to yours. A competitor whose CPI moves with no correlation to your sales is a category player, but not one your customer base is benchmarking against.
Knowing the difference changes how you configure repricing rules. If Competitor A is your real price setter on KVIs but Competitor B is not, tracking parity with Competitor A is a commercial priority. Tracking parity with Competitor B is noise. This level of competitive analysis is what Retailgrid's competitive pricing tools surface automatically - identifying which competitors are actually driving your sales movements, rather than which ones your team has historically monitored out of habit.
Weighted CPI: a more accurate version
The simple average CPI treats every matched product as equal. A more accurate approach weights each product by its revenue contribution:
Weighted CPI = Sum of (Product Price Index x Product Revenue) ÷ Total Revenue of matched products
This produces a CPI that reflects competitive position weighted by what actually matters commercially. A product that contributes 0.1% of revenue moves the simple average CPI the same as a product contributing 15% of revenue. In the weighted version, the high-revenue SKU gets the influence it deserves. For retailers building a CPI calculation into a pricing review process, the weighted CPI is the metric worth tracking over time. The simple average is a useful starting point.
Frequently asked questions
What is the difference between the Competitive Price Index and the Consumer Price Index?
The Consumer Price Index (CPI) is a macroeconomic metric calculated by national statistical agencies to measure inflation across a representative basket of goods. The Competitive Price Index is a retailer-specific metric that measures your prices relative to your competitors across matched products. The two metrics share a name abbreviation but serve completely different purposes. This guide covers the retailer-specific Competitive Price Index - the one used in pricing strategy, not macroeconomic policy.
How many competitors should I include in my CPI calculation?
Include the competitors your customers actually compare you against - not every retailer in your category. A practical starting point is three to five competitors with significant SKU overlap and demonstrable price sensitivity among your customer base. Adding more competitors beyond that tends to dilute the signal rather than sharpen it, particularly if the additional competitors have low overlap or low customer share. Use sales correlation analysis to identify which competitors' CPI movements track most closely with your own sales changes - those are the ones worth including.
How often should I recalculate the Competitive Price Index?
In stable, low-frequency categories, weekly recalculation is sufficient. In electronics, health and beauty, grocery, and FMCG, where competitor prices shift multiple times per day, a daily or even four-hour recalculation is the meaningful standard. The shorter your repricing cycle, the more frequently your CPI needs to update to remain actionable. In practice, manual daily recalculation is not sustainable for any catalog above a few hundred SKUs - which is why automated price monitoring is the operational requirement for CPI-driven pricing at scale.
Want your competitive price index calculated on your own catalog - by product, by competitor, and next to your sales - without building the pipeline yourself? Get in touch and we'll set it up on your data.