From Data to AI Pricing Strategy Deck: A Walk-Through
Walk through Retailgrid's AI pricing strategy briefing - what's in the 7-slide deck, how to read each section, and how to use it in real category reviews.
Every quarter, the head of pricing has to produce the same artefact. A summary of how the category did — sales, margin, units, what changed versus last period. A read on where competitors are positioned. A view on seasonality and what to plan for. A short list of recommended actions, ordered by urgency. The audience varies — exec team, board, commercial partners — but the shape of the deck does not.
The actual work to produce that deck is mostly archaeology. Pull KPIs from BI. Pull the competitor file. Cross-reference seasonality from last year. Reconcile what the merchandising team thinks is happening with what the data says. Format it into slides the CEO will tolerate. Two days, usually three.
Retailgrid's new AI workspace produces that same deck — an AI pricing strategy briefing built from the structured pricing data you already have inside the workspace — in about four minutes. We've been testing it against real client data for the last few weeks, and the pattern matches the wider analyst signal: BCG's 2026 retail predictions put agentic AI for merchandising and pricing as the highest-leverage category-team capability of the year. This piece walks through what the briefing actually contains, what to verify before you ship it, and how to use the output in the real conversations it was meant to support.
What the briefing actually contains
The default output is a seven-slide deck, executive-briefing format, structured around the questions a senior commercial reader will ask in order. Here is the actual structure, slide by slide, using the live demo we generated for a Canadian healthy-food retailer ("Healthy Food Canada", 180-day window).
Slide 1 — Cover. Branding, period, "Strictly Confidential" tag, the prepared-for line. Boring on purpose: this slide signals that what follows is a working board document, not a marketing piece. Worth noticing because most practitioner-built decks skip the framing slide and arrive in the meeting looking like a spreadsheet export.
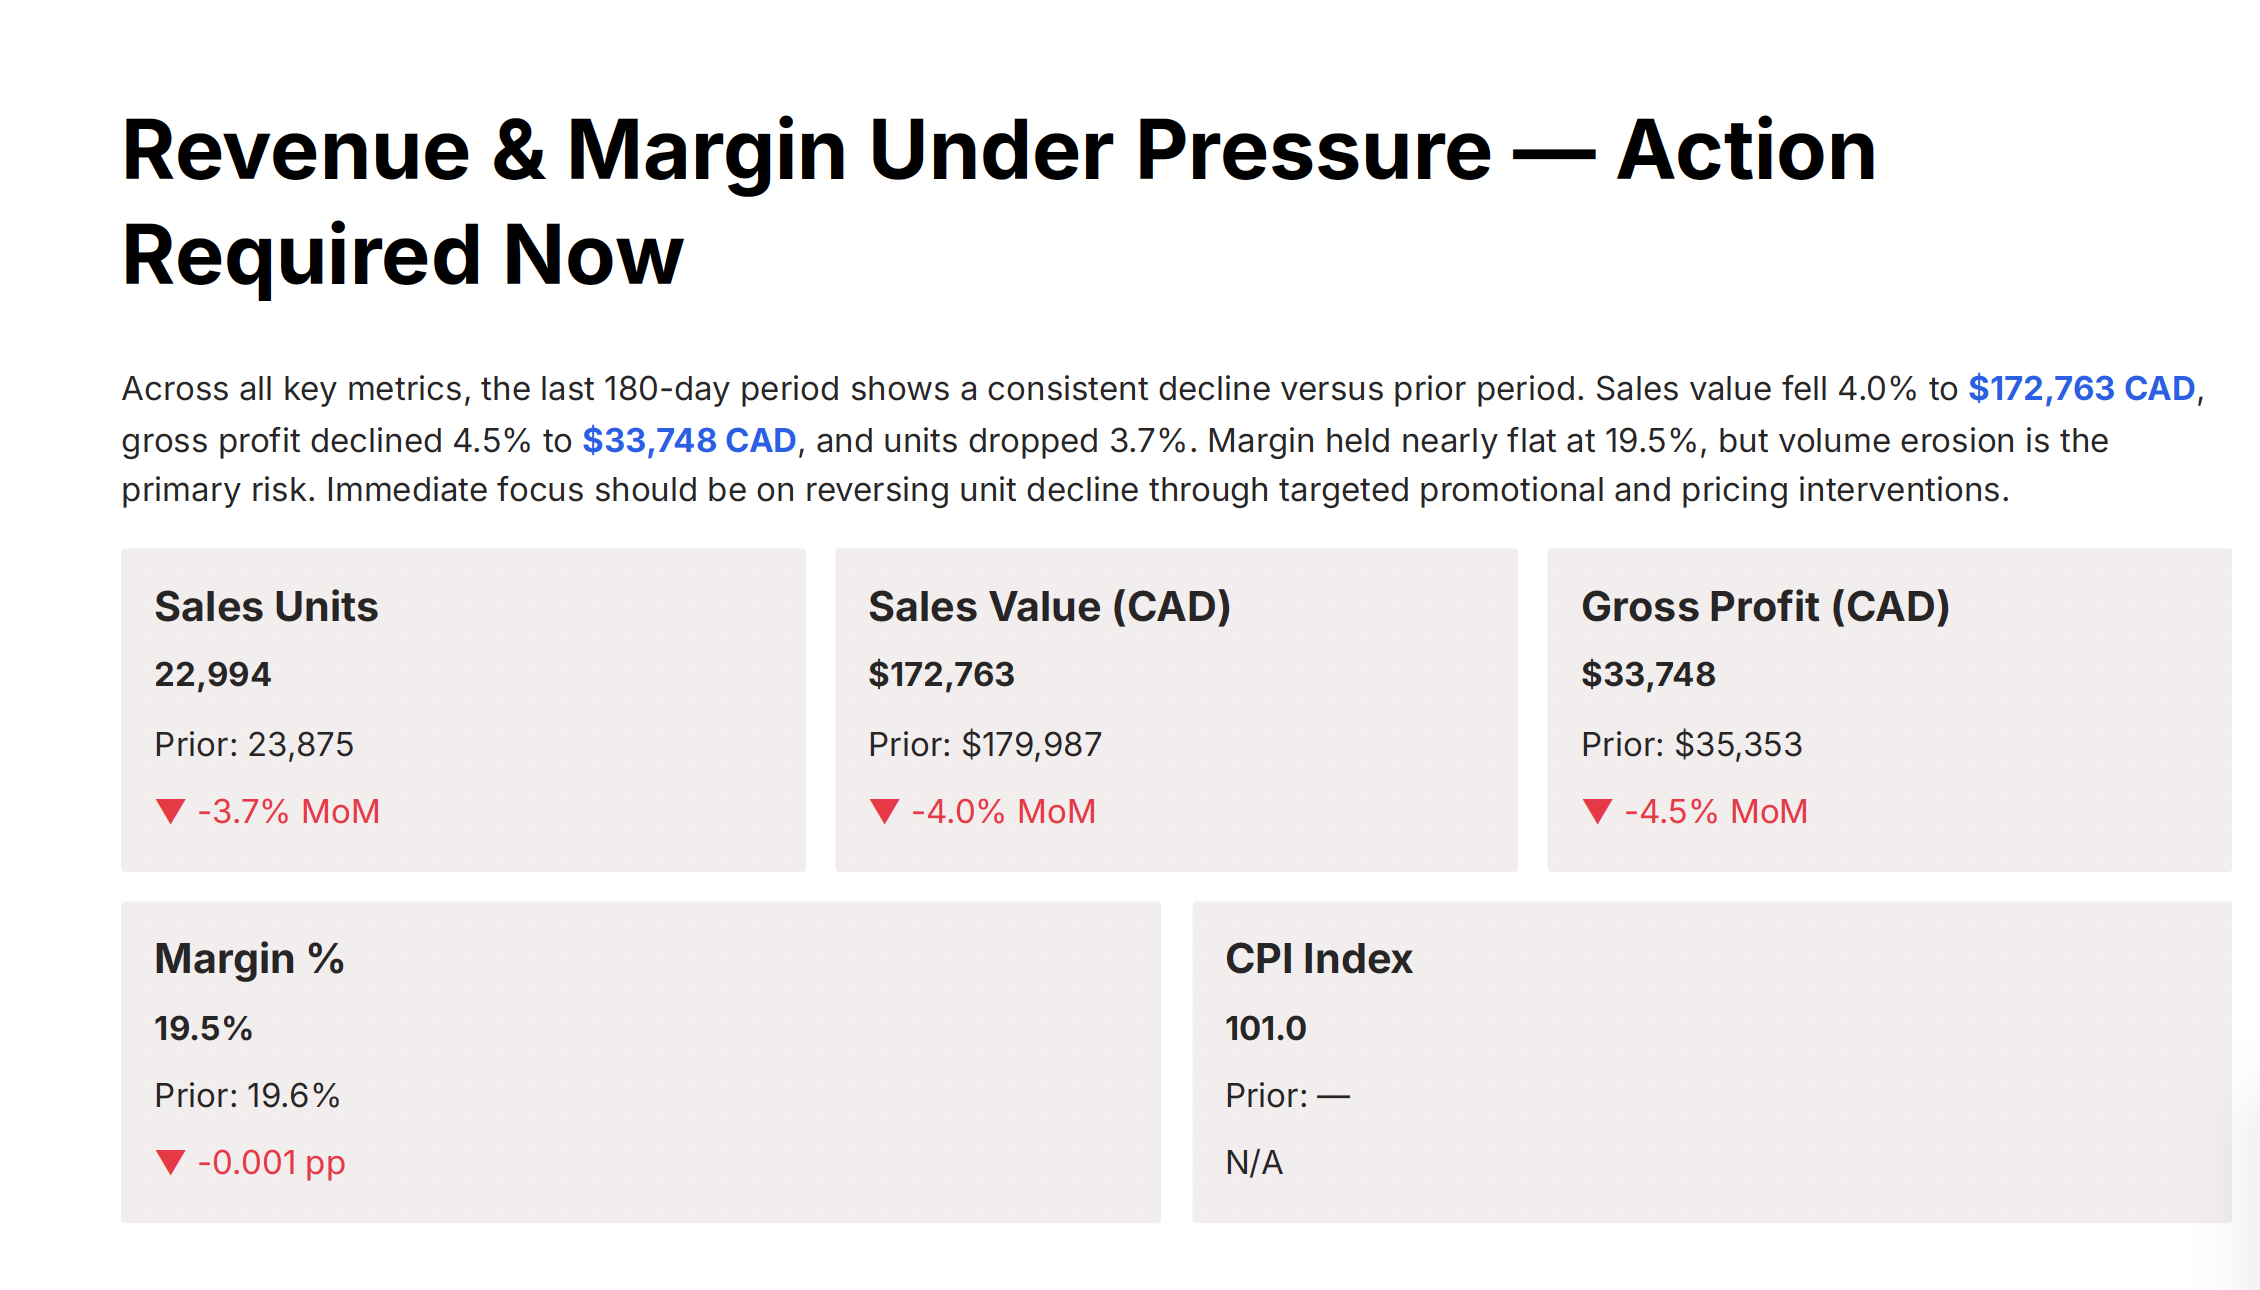
Slide 2 — Executive KPI tiles. Sales units, sales value, gross profit, margin %, CPI index. Each tile shows the current 180-day value, the prior-period comparison, and the delta. For Healthy Food Canada: sales value fell 4.0% to $172,763 CAD, gross profit fell 4.5% to $33,748 CAD, units fell 3.7%, margin held nearly flat. The narrative the AI writes above the tiles is one sentence and gets to the point: margin is fine, volume is the problem.
Slide 3 — Category performance. Sales value, margin %, promo share %, competition coverage %, CPI by category. For a single-category retailer this is a one-row table, but the columns are the ones that matter. Competition coverage % is the one to read first — if you are only seeing 28% of the comparable assortment, you cannot run a confident pricing strategy regardless of what the other columns say.
Slide 4 — Seasonality. Monthly revenue bars overlaid with a seasonality index line. The AI flags clear peaks (June and December for grocery, for this retailer) and — importantly — anomalies. In the demo, May 2026 came back as a 0.17 seasonality index, an 83% drop versus the trailing average. The AI's hypothesis was correct: partial-month data ingestion. The point is that it raised the flag and refused to plan around the anomaly until validated.
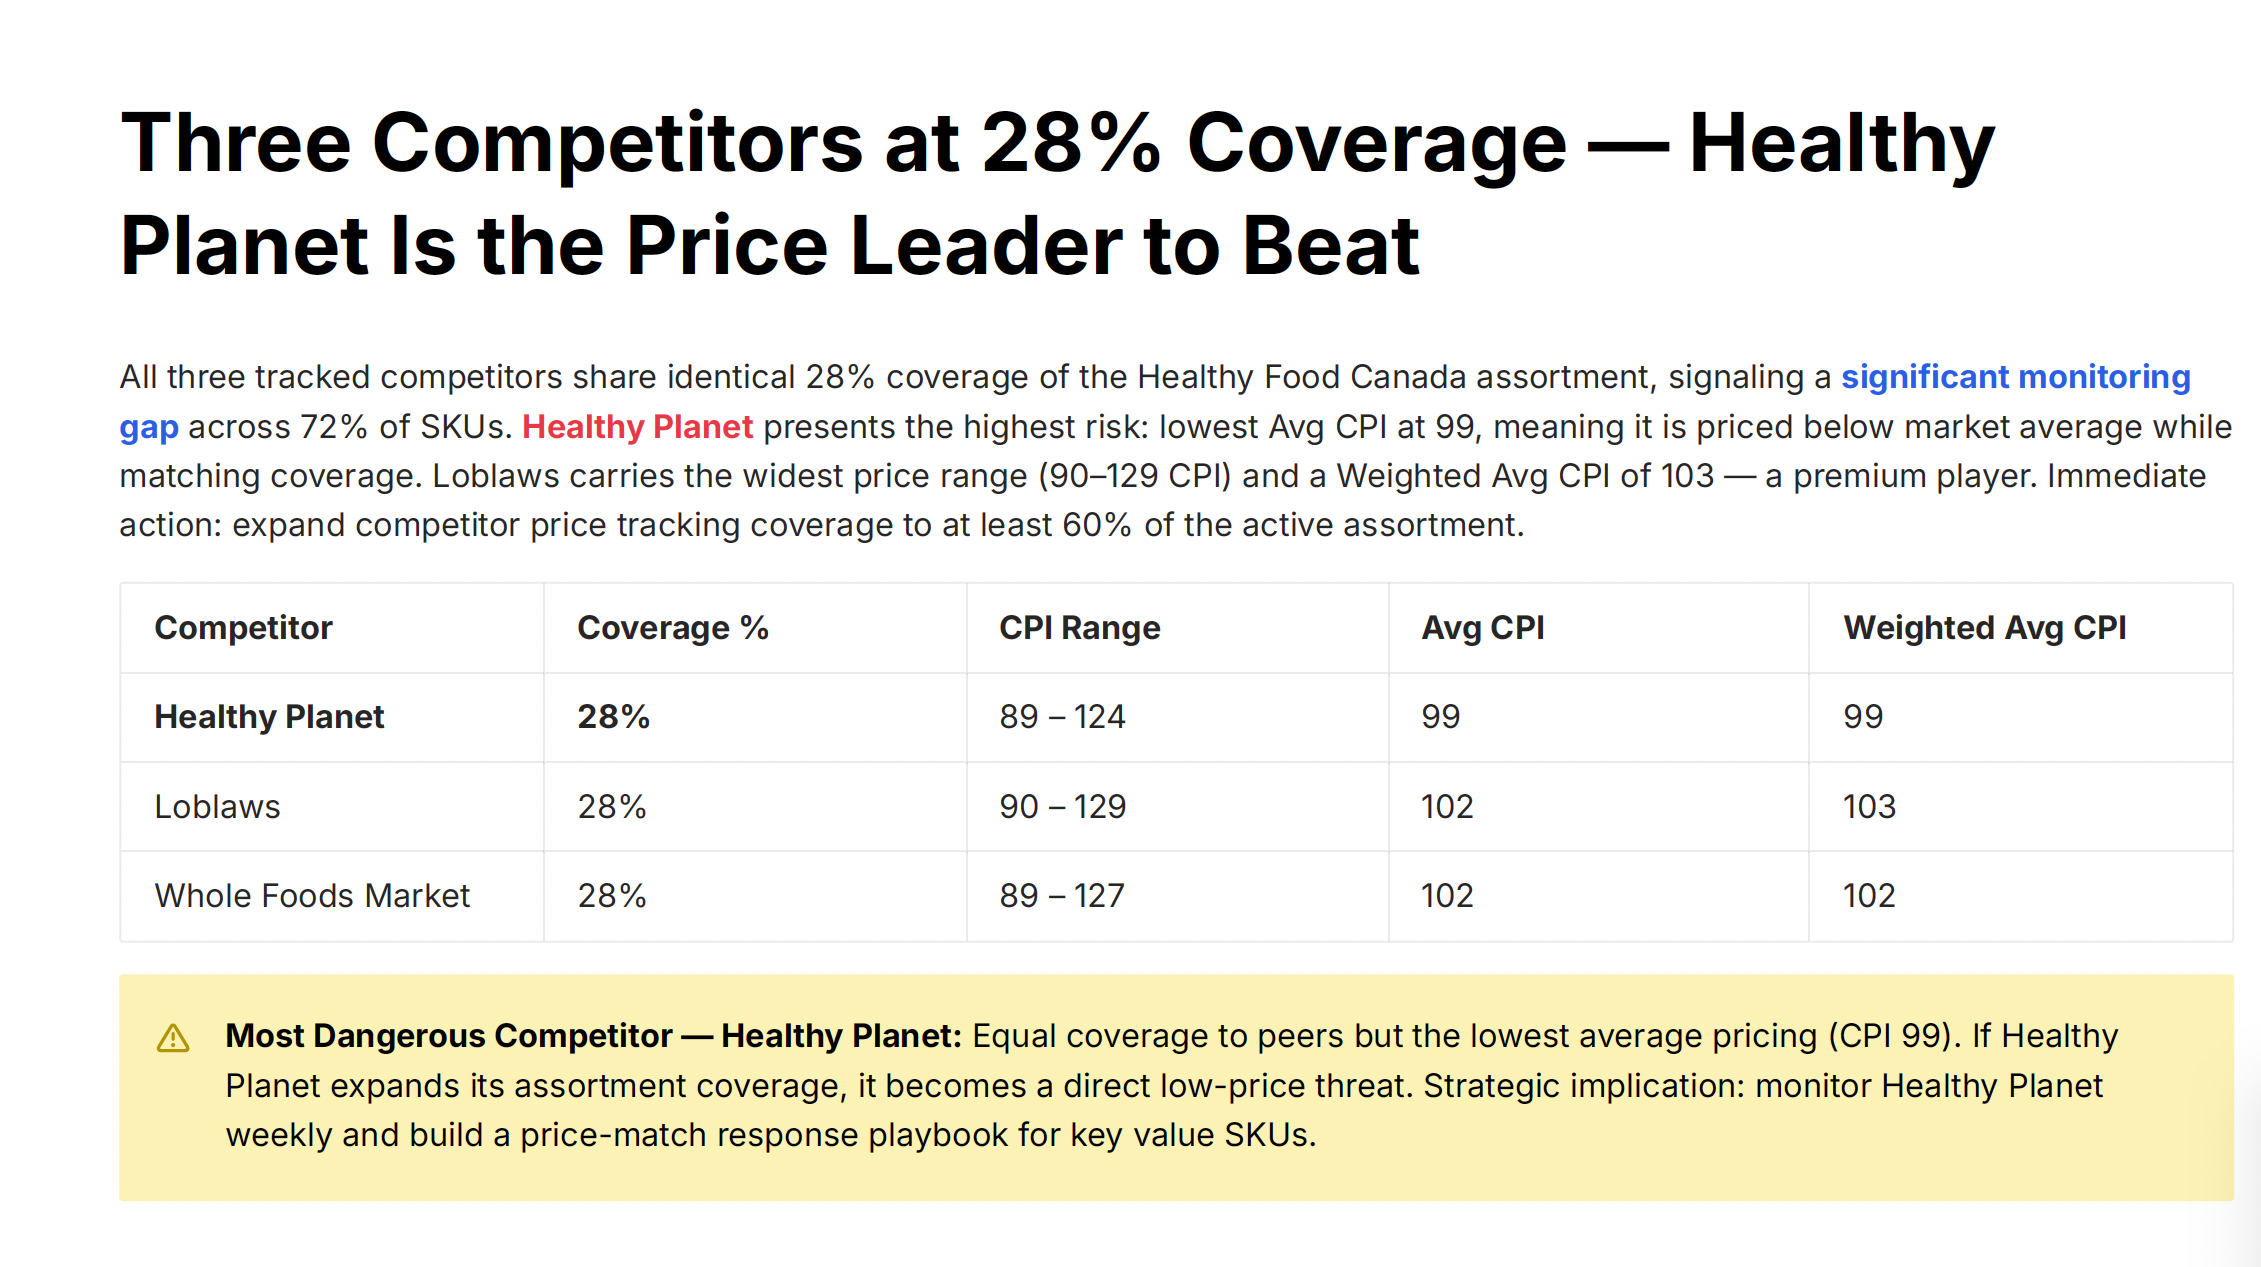
Slide 5 — Competitor benchmark. One row per tracked competitor, with coverage %, CPI range, average CPI, and weighted average CPI. The Healthy Food Canada demo showed three competitors at identical 28% coverage — meaning every tracked competitor is itself only seeing 28% of the assortment, so the 72% blind spot is structural, not a single-competitor problem. The AI named "Healthy Planet" as the most dangerous competitor — lowest average CPI at 99 — and recommended weekly monitoring with a price-match playbook for key value SKUs.
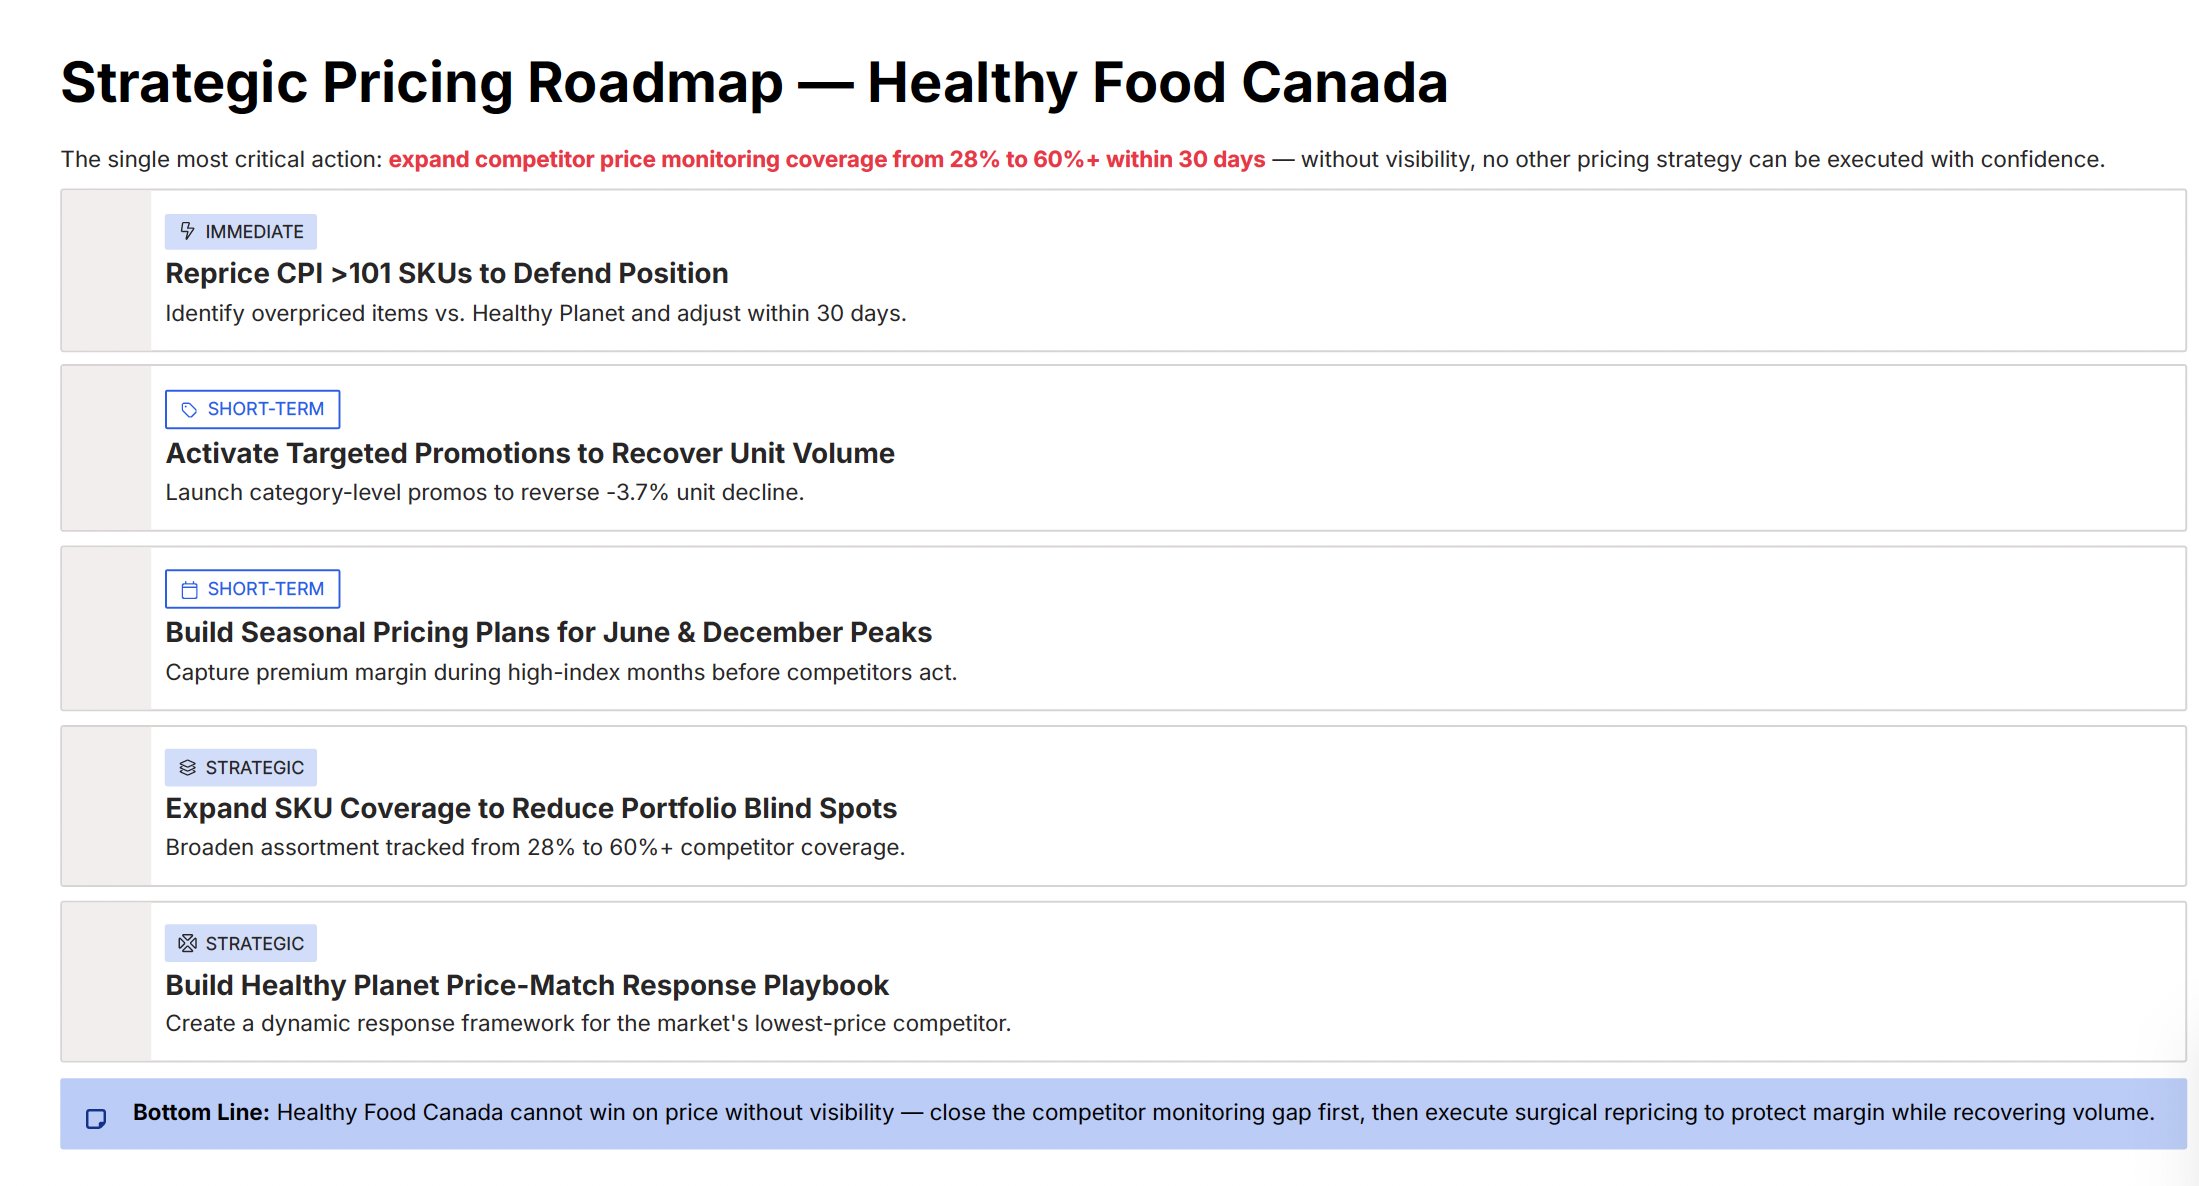
Slide 6 — Strategic pricing roadmap. Five prioritised actions, each tagged Immediate / Short-term / Strategic. Visibility expansion (28% → 60% coverage) was the Immediate. Repricing CPI >101 SKUs, activating targeted promotions, and seasonal pricing plans were Short-term. Building the Healthy Planet response playbook was Strategic. The order is the AI's main contribution: visibility first, then surgical action.
Slide 7 — Closing. Direct CTA to the consulting team. Cleanly factual, no marketing prose.
How to read each section properly
The deck is useful exactly to the extent that the pricing lead reads it like a working analyst, not like a recipient. Three reading habits worth building.
Read the KPI tiles for the leading metric, not the headline. Sales value is down 4.0%, which is the number that will get screenshot into Slack. But sales units are down 3.7% and margin held flat — that combination tells you the problem is volume erosion, not realised price. The recommended action follows from that diagnosis, not from the top-line number. The AI gets this right in its summary, but only if you read the summary instead of the tile.
Treat competition coverage % as the gating field. Almost every slide that follows assumes you have visibility into competitor pricing on a meaningful share of your assortment. When the coverage figure is low — 28% in this demo, but anything below ~60% has the same problem — the rest of the analysis is conditional. The roadmap reflects this: the AI puts visibility expansion in Immediate for a reason. If you push that recommendation back, you are betting against the analysis you just asked it to do.
Trust the anomaly flag more than the explanation. The AI is good at detecting that something is statistically off — a 0.17 seasonality index against a 1.0+ trailing average is impossible-to-miss. It is less reliable at why. Treat "partial-month data ingestion" as a hypothesis, validate it against the source system, and only then proceed. The deck makes this easy because it explicitly recommends validation; the failure mode is taking the recommendation at face value without doing the validation step.
What the AI gets right — and what to verify
After running the briefing against a few different datasets, the pattern of strengths and weaknesses is fairly consistent.
What it gets right: structural framing. The AI is unusually good at noticing patterns the team has internalised and stopped seeing — "you have a 72% coverage blind spot", "every competitor is symmetrically incomplete", "this category is 100% of your revenue and you have no promo activity". These are not analytical insights so much as obvious-once-named patterns, but obvious-once-named is what category meetings are usually missing.
What it gets right: roadmap sequencing. The Immediate / Short-term / Strategic tagging is conservative in a useful way. The AI does not put surgical SKU repricing as the first action when the underlying coverage is below 30%, even though SKU repricing is the easier, more tactical action. It puts coverage expansion first, because nothing else works without it. This is the kind of decision a junior analyst will reverse to avoid the harder recommendation; the AI does not.
What to verify: cost-side context. The deck reads the data the workspace has. If a major cost change is incoming (a tariff, a contract renewal, a supplier price increase the merch team is negotiating), the AI cannot see it, will not surface it, and may recommend repricing actions that the cost news will overrule in three weeks. The pricing lead's job is to overlay the context the workspace does not yet hold.
What to verify: weighted versus unweighted competitor CPI. The AI reports both. Use the weighted figure when you are making assortment-level decisions and the raw average when you are checking individual category subsets. The deck does not explain which to use when; that is your judgement, and the deck supports both.
What to verify: anything tagged "anomaly". The AI is right to flag, and frequently wrong about the cause. Validate from the source.
How to actually use the deck
The deck is not the deliverable. The deck is the starting point for three conversations the pricing lead is going to have anyway.
Conversation one: the quarterly pricing review. Drop the seven slides into the standing meeting agenda. You have saved roughly two days of slide construction and produced a more analytically honest version than the manual one — the AI will tell you the data has gaps, where a slide team is incentivised to paper over them. The meeting can spend its time on the decisions, not the assembly of the picture.
Conversation two: cross-functional alignment. Merchandising, supply, finance, and commercial leads all build their own version of "where pricing is right now" from incomplete inputs. The briefing becomes the shared artefact — the single object everyone disagrees from, instead of disagreeing about. The roadmap slide is the most useful for this; people disagree about priorities much more cleanly than they disagree about analysis.
Conversation three: external advisors and partners. When a consulting firm, an integrator, or a partner agency asks "what is your current pricing position" — and they do, every time — the briefing is the answer. It saves the week of intake interviews that those engagements usually begin with. It also frames the engagement in your data, not theirs, which is a better starting position than most retailers manage when they hire outside help.
The bigger workflow shift
The thing that makes any of this work is the layer underneath. The AI briefing is generated from the structured pricing workspace — the same workspace that holds the price ladder, the KVI list, the rule per SKU role, the competitor matches, the audit trail. The AI did not invent the analysis; it summarised structured data that was already there.
Retailers who run pricing in seven spreadsheets cannot generate this briefing meaningfully, even with a clever model on top. The model is only as good as the structure under it; a model summarising spreadsheets produces spreadsheet-shaped guesses. The retailers who have done the boring work of structuring their pricing — tier definitions, role assignments, explicit rules, weekly cadence — get the second piece for nearly free. The structuring is the project; the AI is the leverage.
That is the practitioner-level takeaway. The AI workspace is not a magic trick that compresses pricing work into four minutes. It is a four-minute exit from work the retailer was going to do for two days anyway — but only if the underlying workspace is structured enough to be summarised.
Try it
If you want to see this run against your own data, the demo takes a representative slice of your assortment and produces a real briefing in the same format. The product page covers the underlying structured-pricing workspace the briefing is generated from. If you want to talk through what the deck would say about your specific category mix before any of that, the team at consulting@retailgrid.io is the right address.